

A controller health dashboard is a compression of a great deal of telemetry into a small number of scores, and compression discards information. That is not a criticism — a dashboard that showed everything would be useless — but it means the number on the screen is an answer to a question that was defined by somebody else, and using it well requires knowing what that question was. A device scoring poorly and a device that is broken are overlapping sets, not the same set.
The failure mode this produces is predictable in both directions. Teams that trust the score investigate healthy devices that happen to look bad, and teams that distrust it stop looking at the dashboard entirely and lose the genuine findings buried in it. Both are avoidable by understanding two things: what each score is computed from, and what has to be working for the data behind it to exist at all.
This article covers what the health scores actually measure, where the underlying data comes from and how that pipeline breaks, how to check the controller itself rather than what it is reporting on, how to run a health check around a change so that it is useful rather than decorative, and which findings are reliably real and which are reliably noise.
What Is a Health Score Actually Measuring?
What goes into each one?
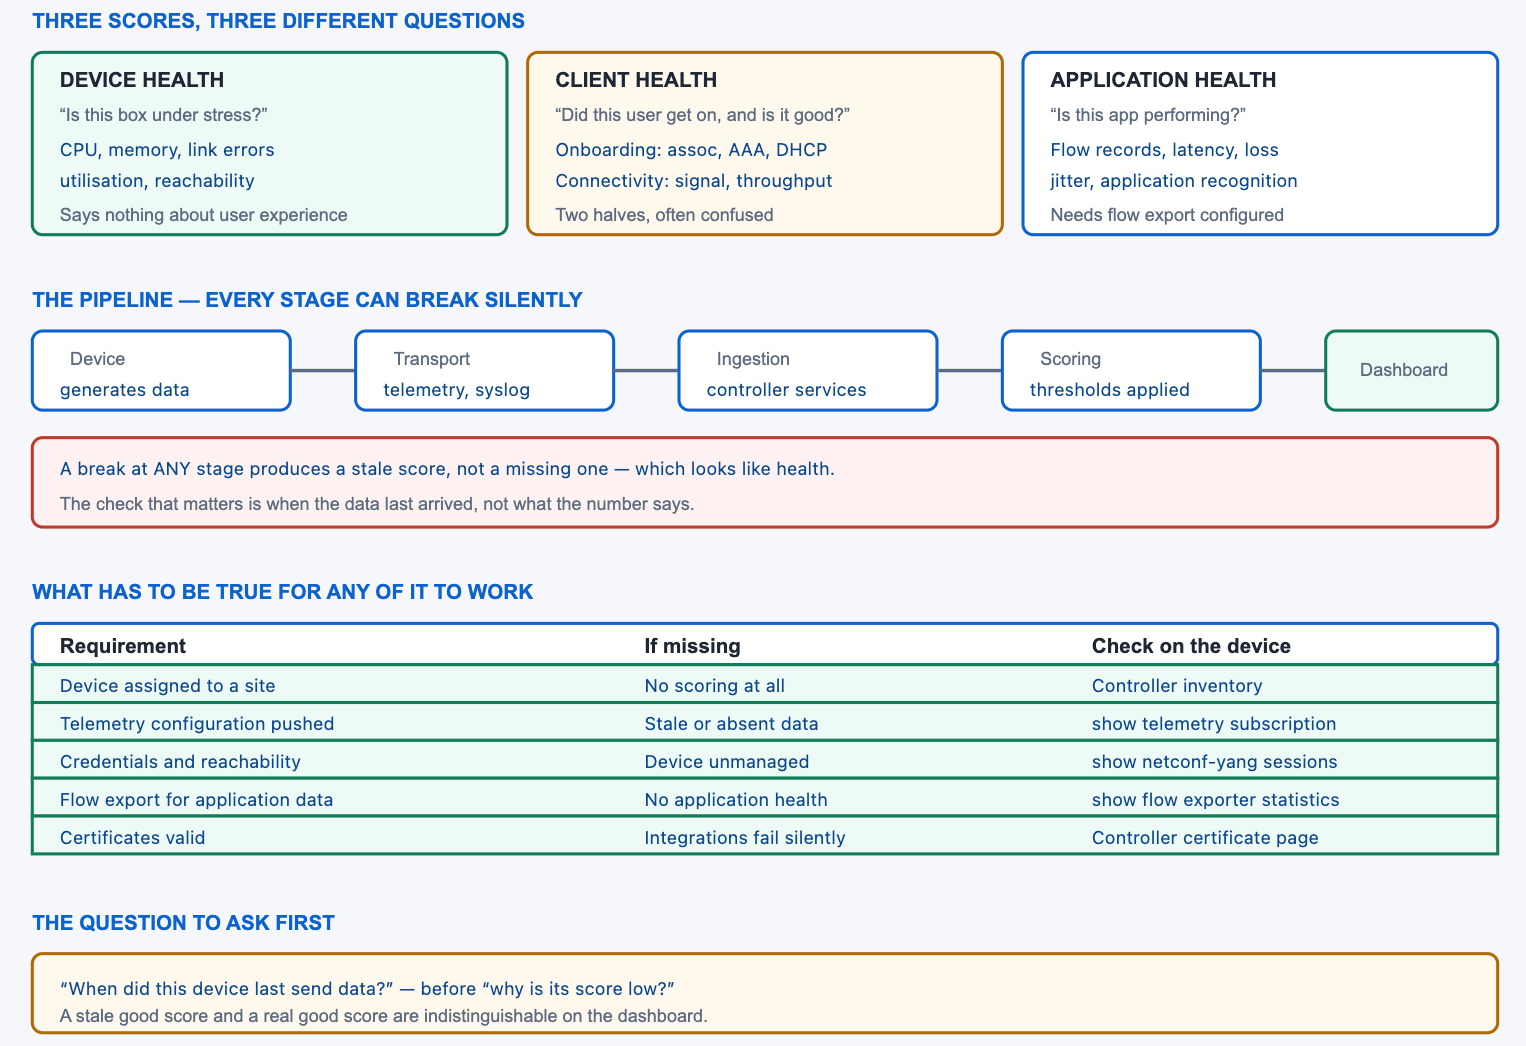
Device health is about the box: processor and memory pressure, interface errors and utilisation, and reachability from the controller. Client health has two distinct halves — whether the client successfully got onto the network, and whether the connection it got is any good — which are frequently conflated and have completely different causes. Application health is derived from flow records and needs flow export to be configured, without which it does not exist at all rather than being reported as poor.
A Deeper Dive into the Scores
Device health says nothing about user experience
A switch with idle processors, no interface errors and full reachability scores well and may still be delivering an unusable service — because it is correctly forwarding traffic into a congested uplink, or because a policy is denying something, or because the problem is two hops away. Device health is a statement about the device, not about what is happening through it, and treating a green device list as evidence that users are fine is the most common misreading of the whole system.
! What device health is looking at, from the device side
EDGE1# show processes cpu sorted | include five seconds
CPU utilization for five seconds: 12%/3%; one minute: 11%
!
EDGE1# show processes memory sorted | include Total
!
EDGE1# show interfaces | include error|CRC|drops
!
! None of these says anything about whether users can work.
The two halves of client health
Onboarding covers association, authentication and address acquisition — a client either got on or it did not, and a failure here has a specific cause at a specific step. Connectivity covers the quality of the session once established. A client that scores poorly for onboarding has an authentication or DHCP problem; one that scores poorly for connectivity has a radio or throughput problem. Reading the score without knowing which half it came from sends the investigation to the wrong place half the time.
| Poor score in | Means | Investigate | Not |
|---|---|---|---|
| Onboarding — association | Never got associated | Radio, AP, client driver | Authentication |
| Onboarding — authentication | Association fine, auth failed | Policy server, credentials | RF |
| Onboarding — addressing | Authenticated, no address | DHCP relay, scope, reachability | Authentication |
| Connectivity — signal | Connected, poor RF | Coverage, interference | Anything wired |
| Connectivity — throughput | Connected, slow | Uplink, congestion, policy | RF, necessarily |
Application health depends on flow export
Application scores come from flow records exported by devices, so a device not exporting flows contributes nothing and the applications traversing it are simply invisible. This is materially different from a poor score: absence of data and evidence of a problem look similar on a dashboard and are opposite conclusions. Checking that export is configured and that records are actually being sent is the prerequisite for taking any application finding seriously.
! Is this device exporting flows at all?
EDGE1# show flow exporter statistics
Flow Exporter DNAC_EXPORTER:
  Packet send statistics (last cleared 4d02h ago):
    Successfully sent:         184221  (24188392 bytes)
    Reason not given:          0
    Enqueued for staging:      0
!
EDGE1# show flow monitor
EDGE1# show flow monitor DNAC_MONITOR cache | include entries
!
! Zero sent, or no exporter at all, means the application
! data for this device does not exist.
Fabric devices have extra dimensions
A switch that is also a fabric node has state that a general device health score cannot fully express: whether it is registered with both control plane nodes, whether its policy integration is complete, whether its endpoint registrations are succeeding. These are binary conditions with real consequences, and they are worth checking directly rather than inferring from a composite score that is dominated by processor and interface metrics.
The practical approach is to treat fabric state as a separate check running alongside the health dashboard rather than expecting the dashboard to cover it. Four commands per edge node cover it completely and they are cheap enough to run on a schedule, which turns a category of silent failure into an alert.
! Fabric state, which a general health score does not capture
EDGE1# show lisp session
Sessions for VRF default, total: 2, established: 2
!
EDGE1# show cts environment-data | include state
Current state = COMPLETE
!
EDGE1# show lisp instance-id 4099 ipv4 database | count /32
!
EDGE1# show access-tunnel summary | include Number
!
! Two sessions, COMPLETE state, a plausible endpoint count
! and the expected AP count. Anything else is a finding.
Thresholds are opinions
Every score is a threshold applied to a measurement, and the thresholds are defaults chosen to be reasonable across a wide range of networks. A link that is deliberately run at high utilisation, a device with a known process that consumes processor time, or an access point in a genuinely difficult radio environment will score poorly forever and correctly. Adjusting thresholds where the default is wrong for your environment is what turns a noisy dashboard into a useful one, and it is skipped far more often than it is done.
Where Does Assurance Data Come From, and What Breaks It?
What are the sources?
Four families. Polled data, gathered on a schedule and good for slow-moving counters. Streamed telemetry, pushed by the device as it changes and good for anything time-sensitive. Event data — syslog and traps — which carries things that happen rather than things that are. And flow records, which are the basis of everything application-related. Each has its own configuration, its own transport and its own way of failing.
A Deeper Dive into the Pipeline
Telemetry configuration is pushed, not typed
The controller configures devices to send telemetry to it, which means the device's telemetry configuration is generated rather than authored — and can be absent because the push failed, because the device was added without the setting enabled, or because someone removed it during unrelated troubleshooting. Checking that the subscriptions exist on the device is the fastest way to distinguish "this device is healthy" from "this device is not reporting".
! What the controller pushed, seen from the device
EDGE1# show telemetry ietf subscription all
  ID               Type        State       Filter type
  2147483648       Configured  Valid       tdl-uri
  2147483649       Configured  Valid       tdl-uri
!
EDGE1# show telemetry ietf subscription all receiver
  ID          Name        Last State Change   State
  2147483648  DNAC        4d02h               Connected
!
! State anything other than Valid and Connected means
! this device's data is not arriving.
!
EDGE1# show telemetry internal connection
The management channel
The controller configures devices over a model-driven interface and reads them over it too, so a device whose management session is not established is one the controller cannot configure or query — even if it responds to ping and is forwarding traffic perfectly. This is a common state after a credential change, a certificate expiry, or an access list applied to management traffic.
! Is the controller's management session actually up?
EDGE1# show netconf-yang sessions
R: Global-lock on running datastore
Number of sessions : 1
session-id  transport  username  source-host    global-lock
1           netconf-ssh  dnacadmin  10.50.50.20   None
!
! And whether anything is blocking it
EDGE1# show run | include ^netconf|^restconf
EDGE1# show ip access-lists | include 830|22
!
! Also the older polled path, which may still be in use
EDGE1# show snmp | include packets|SNMP agent
Certificates, which expire quietly
Every integration in this stack rests on certificates — between the controller and devices, and between the controller and the identity platform. They expire on a schedule nobody is watching, and the failure is not an error but a silently broken integration: group information stops synchronising, or a data source stops reporting, and the dashboard keeps showing whatever it last knew. This is worth an explicit calendar entry rather than a monitoring rule, because the monitoring itself is what stops working.
! On network devices, the trustpoints in use
EDGE1# show crypto pki certificates | include Status|End date|Subject
Certificate Status: Available
  Validity Date:
    end   date: 04:12:33 UTC Mar 14 2027
!
EDGE1# show crypto pki trustpoints status | include State|Trustpoint
!
! And the device's own identity for policy integration
EDGE1# show cts credentials
EDGE1# show cts environment-data | include state|Status
What each source failure looks like
| Source | Carries | When it fails | Check |
|---|---|---|---|
| Streaming telemetry | Interface, CPU, memory, fabric state | Scores freeze at last value | show telemetry ietf subscription all |
| Polled counters | Slow-moving state | Gaps in trend graphs | show snmp, credentials |
| Syslog | Events, state changes | Events missing, no score change | show logging | include host |
| Flow records | Application data | Application health absent, not poor | show flow exporter statistics |
| Wireless telemetry | Client and AP data | Client health stale | Controller-to-controller reachability |
show telemetry ietf subscription all receiver on the device shows a receiver that is not connected, or the controller's last-updated timestamp for the device is hours old. Fix: re-push the telemetry configuration, and add a check on data freshness rather than only on score values — the freshness check is the one that catches this class entirely.How Do I Check the Controller Itself Is Healthy?
What is worth checking?
Five things, in roughly this order. The platform: node status, disk, and the internal services that everything else depends on. The integrations: the identity platform connection and any other external system. Certificates and their expiry dates. Backup status, because a controller without a recent backup is a much larger problem than any score on it. And inventory synchronisation, because a device the controller has not successfully read recently is one whose configuration and health data are both out of date.
A Deeper Dive into Controller Health
The platform underneath
A controller runs a substantial software stack, and problems in it manifest as odd behaviour in the interface rather than as clear errors — a page that does not load, a workflow that fails partway, data that stops updating for one category. Checking the platform's own status before investigating what it is reporting saves attributing a controller problem to the network.
Integration status, which fails silently
The connection to the identity platform is what synchronises group definitions and pushes policy, and it can fail without any other symptom. When it does, policy authored centrally does not reach the identity platform, which means it does not reach switches, which means the matrix in the interface and the matrix being enforced diverge. That divergence is invisible from either end.
! From the device side, the effect of a broken integration
EDGE1# show cts environment-data | include state|Status|Server
Current state = COMPLETE
          Status = ALIVE
! ^ This proves the DEVICE-to-ISE path. It does not prove
!   the CONTROLLER-to-ISE path, which is separate.
!
! Confirm policy authored centrally actually arrived
EDGE1# cts refresh policy
EDGE1# show cts role-based permissions
! ^ Compare against what the authoring interface shows.
!   A persistent difference is an integration problem.
Inventory synchronisation
A device the controller cannot read is one whose inventory record ages. It continues to appear, continues to show its last known configuration, and stops reflecting reality — which matters most at exactly the wrong moment, when someone uses the controller to check what a device is configured for during an incident. Resynchronising is cheap and confirms both reachability and credentials in one action.
! Device-side evidence that the controller can manage it
EDGE1# show netconf-yang sessions
EDGE1# show users | include dnac|netconf
!
! Recent configuration changes the controller may not know about
EDGE1# show archive config differences
EDGE1# show configuration lock
EDGE1# show logging | include CONFIG_I
! ^ A local change made outside the controller is exactly
!   what makes the inventory record wrong.
Retention, and why it decides what you can investigate
Assurance data is kept for a bounded period, and that period sets a hard limit on what can be investigated after the fact. A problem reported a fortnight after it occurred cannot be examined if the detailed data covers seven days, regardless of how good the tooling is. This surfaces at the worst moment — during a post-incident review, when the question is what the network was doing at a specific past time.
Knowing the retention windows in advance changes behaviour usefully: it makes exporting a snapshot part of incident handling rather than an afterthought, and it makes the case for longer retention concrete rather than theoretical. The cheap mitigation is to capture the relevant views at the time an incident is raised, while the data still exists, even if nobody intends to look at them immediately.
Software version consistency
A site running four software versions across its switches has four sets of behaviour, four sets of known issues, and four sets of feature availability — and the divergence is invisible on a health dashboard because every individual device is fine. Version consistency is a health property of the site rather than of any device, and checking it is a matter of listing versions and counting distinct values.
The consequence in a fabric is larger than in a traditional network, because the fabric features being used depend on the software supporting them. A single switch on an older release can be the reason one closet behaves differently, and the investigation into that difference will look at configuration long before it looks at versions.
! Version consistency, which is a site property
EDGE1# show version | include Version|System image
Cisco IOS XE Software, Version 17.09.04a
!
! Collect across the site and count distinct values
!   for each device: show version | include ^Cisco IOS XE
!   expect exactly one distinct string per platform family
!
! And the licence state, which gates some features
EDGE1# show license summary
EDGE1# show license usage | include Status|Description
Backups, which are the real health check
Every other item on this list affects visibility. A missing backup affects recoverability, which is a different order of problem — a controller holding the site hierarchy, the policy matrix, the provisioning intent and the device inventory is not something to rebuild from memory. Backup age is the single most consequential item in a controller health check and the one least likely to appear on a dashboard.
A controller health checklist
| Item | Frequency | Consequence if wrong |
|---|---|---|
| Backup completed and recent | Weekly | Unrecoverable configuration loss |
| Certificate expiry dates | Quarterly, with calendar entries | Silent integration failure |
| Identity platform integration | Weekly | Policy divergence between intent and enforcement |
| Device inventory sync status | Weekly | Stale configuration records during incidents |
| Telemetry freshness per device | Daily, automated | Stale scores that look healthy |
| Platform node and disk status | Daily, automated | Interface failures, ingestion loss |
How Do I Run a Health Check Around a Change?
What makes a health check useful?
Having a before. A health check run only after a change tells you what the network looks like, not what changed — and since every network has some devices scoring poorly for reasons that predate the change, an after-only check produces a list of findings with no way to tell which are new. The before is what converts the exercise from an inventory of imperfections into a statement about the change.
A Deeper Dive into Change Verification
Capture the before, mechanically
The capture should be a fixed set of outputs saved with a timestamp, not an impression formed by looking at a dashboard. The value is entirely in being able to diff it, which requires the after to be captured the same way. This is dull work and it is the difference between "several devices are showing errors" and "these two devices started showing errors during the window".
! Capture the same set before and after, per device
show version | include uptime|Version
show inventory | include PID
show processes cpu sorted | include five seconds
show interfaces | include line protocol|error|CRC
show ip route summary
show logging | include ERR|CRIT|ALERT
show telemetry ietf subscription all receiver
!
! Fabric-specific, on fabric devices
show lisp session
show lisp instance-id 4099 ipv4 database | count /32
show cts environment-data | include state
show cts role-based counters
!
! Save with a timestamp. The diff is the deliverable.
What to check specifically after a device change
Upgrades and replacements have a predictable set of things that break, and checking them explicitly is faster than waiting for a score to drop. The telemetry subscription frequently does not survive an upgrade. Interface configuration on ports the controller does not manage may be lost on a replacement. And the device's identity for policy integration is stored locally and does not necessarily persist.
! After an upgrade or a replacement, explicitly
!
! 1. Telemetry still configured?
EDGE1# show telemetry ietf subscription all receiver
!
! 2. Policy integration still working?
EDGE1# show cts environment-data | include state|Status
EDGE1# show cts credentials
!
! 3. Fabric state rebuilt?
EDGE1# show lisp session
EDGE1# show access-tunnel summary
!
! 4. MTU survived?
EDGE1# show system mtu
EDGE1# show interfaces | include MTU
!
! 5. Endpoints re-registering?
EDGE1# show lisp instance-id 4099 ipv4 database | count /32
Deciding in advance what would abort the change
A post-change check is only a decision point if the criteria were written before the change. Otherwise the outcome is negotiated in the moment, at 2am, by people who want to go home — and the answer is almost always to proceed. Writing three or four specific conditions beforehand, each with a threshold, converts that conversation into a lookup.
The conditions worth choosing are ones that are unambiguous and quick to evaluate: fabric sessions not both established, endpoint count materially below the before figure, any new error class in the logs, telemetry receiver not connected. Each is a yes or no, each takes seconds, and any of them being true is a reason to roll back rather than to discuss.
Waiting long enough
Scores are computed over a window, so a check run two minutes after a change reflects mostly pre-change data and a check run an hour later reflects mostly post-change data. Knowing roughly what that window is prevents both false reassurance immediately after a change and unnecessary alarm from a score that has not yet recovered. When in doubt, the device-side outputs are immediate and the scores are not.
What a good post-change check produces
| Output | Says | Action if it differs |
|---|---|---|
| Interface error counters | Physical layer unchanged | Check optics, cabling, duplex |
| Route and endpoint counts | Control plane converged | Compare against the before figure |
| Telemetry receiver state | Visibility restored | Re-push telemetry configuration |
| Policy environment state | Integration working | Check credentials and reachability |
| Fabric session state | Registered with both CP nodes | Investigate before the next window |
| Log severity summary | No new error classes | Read the new messages, not the count |
Which Health Findings Are Real and Which Are Noise?
How do I tell them apart?
By whether the finding is about a threshold or about a state. Threshold findings — processor utilisation, link utilisation, signal strength — are opinions about a measurement and are frequently correct-but-irrelevant for a given environment. State findings — a session down, an integration failed, a device unreachable, a subscription not connected — are binary and are almost always real. Sorting findings into those two categories before investigating any of them is the highest-value habit in this area.
A Deeper Dive into Triage
The findings that are reliably real
Anything binary. A control plane session that is not established. A telemetry receiver not connected. A device the controller cannot reach. A policy integration in an incomplete state. A certificate past its date. None of these is a judgement call, none is affected by threshold choices, and each has a specific cause worth finding. They also tend to be under-represented on dashboards relative to the threshold findings, which are more numerous and more colourful.
! Binary state checks - these are always worth acting on
EDGE1# show lisp session | include Up|Down
EDGE1# show telemetry ietf subscription all receiver | include Connected
EDGE1# show cts environment-data | include state
EDGE1# show netconf-yang sessions | include Number
EDGE1# show crypto pki certificates | include end date
!
! Any of these in an unexpected state is a genuine finding,
! regardless of what the health score says.
The findings that are frequently noise
The finding that is real and looks like noise
The stale score
show telemetry ietf subscription all receiver on the device shows a disconnected receiver. Fix: monitor data freshness as a first-class metric alongside the scores themselves — it is the only check that catches this, and it catches every instance of it.A triage order that works
! Sort before investigating
!
! 1. Freshness - is any of this data current?
!    (last-updated timestamps, receiver state)
!
! 2. Binary state findings - always real
!    sessions down, integrations failed, unreachable devices
!
! 3. New threshold findings - possibly real
!    compare against the standing list from last week
!
! 4. Standing threshold findings - tune or fix, do not chase
!
! Steps 1 and 2 take minutes and contain most of the value.
Who the dashboard is for
A health dashboard serves two audiences with different needs, and trying to serve both from one view is why so many end up satisfying neither. An operations team wants a short list of things that are wrong now and need action today. A planning audience wants trends — which sites are degrading, where capacity is being consumed, whether last quarter's work improved anything. The first needs the standing noise removed; the second needs it retained as context.
Separating those into different views, or at least different review cadences, resolves most of the tension. The daily operational review looks only at binary state findings and anything new since yesterday. The monthly review looks at trends and at the standing list, and is where threshold tuning decisions actually get made. Running one review for both purposes produces a meeting where nobody acts on anything, because the items that need action are indistinguishable from the background.
What to do with a finding you cannot explain
Some findings resist explanation: a score that moves without any corresponding change, an error counter that increments occasionally, a device that briefly loses a session and recovers. The temptation is either to escalate immediately or to dismiss it, and both are premature. The productive middle step is to characterise it — how often, at what times, on which devices, correlated with what — because a finding with a pattern is a different problem from one without.
Characterising costs little and frequently resolves the question on its own. An error that occurs every night at the same time is a scheduled job somewhere. One that occurs on every device in one closet is that closet's uplink. One that occurs randomly across the estate at a low rate is often a threshold set slightly too tight. None of those conclusions is available from a single observation.
Blueprint framing
The CCIE Enterprise Infrastructure v1.1 blueprint covers assurance and automation within the software-defined infrastructure domain, and the useful framing is about data sources and what each one measures rather than about interface navigation. Being able to say where device health comes from, why application health requires flow export, and what happens to a score when telemetry stops is what that material is actually about.
Conclusion
A health score compresses a great deal of telemetry into one number, and using it well means knowing what was compressed. Device health is about the box and says nothing about user experience. Client health has two halves with different causes that are routinely conflated. Application health depends on flow export and is absent rather than poor when that export is missing. Each is a starting point for an investigation and none is a conclusion.
The pipeline behind those scores fails in one characteristic way: it produces stale data rather than missing data. A device that stops reporting keeps its last score and looks healthy, which makes freshness a more informative thing to monitor than the scores themselves. That single observation reframes a health check — the first question is when the data last arrived, and only then what it says.
Finally, the controller's own health is worth more attention than the dashboard it presents. Certificates expire quietly and break integrations without an error. Inventory records age and become wrong at exactly the moment someone relies on them. And backup status, which appears on no dashboard, is the only item in the routine whose failure is not merely a visibility problem — which is a good argument for putting it first rather than last.
External Links
- RFC 6241 — Network Configuration Protocol (NETCONF)
- RFC 8040 — RESTCONF Protocol
- RFC 8639 — Subscription to YANG Notifications
- RFC 7011 — Specification of the IP Flow Information Export (IPFIX) Protocol
- RFC 5424 — The Syslog Protocol
- Cisco IOS XE — Programmability Configuration Guide
- Cisco Learning Network — CCIE Enterprise Infrastructure
Reference Notes
- RFC 6241 specifies NETCONF, the configuration protocol over which a controller reads and writes device configuration.
- RFC 8040 specifies RESTCONF, an HTTP-based interface to the same datastore model used by NETCONF.
- RFC 8639 defines subscriptions to YANG notifications, the basis for the model-driven telemetry a device streams to a collector.
- RFC 7011 specifies IPFIX, the flow export protocol underlying application-level visibility.
- RFC 5424 specifies the syslog protocol used to carry event data from devices to a collector.
- Cisco IOS XE programmability documentation describes telemetry subscription configuration and the
show telemetry ietf subscriptioncommand family used to verify it. - Cisco IOS XE documentation describes
show netconf-yang sessions, which reports active management sessions to the device. - Cisco IOS XE documentation describes
show flow exporter statistics, which reports whether flow records are being successfully sent to a collector. - Cisco documentation describes device controllability, by which a controller pushes the telemetry and management configuration required for assurance data collection.
- Cisco TrustSec documentation describes
show cts environment-data, whose state field indicates whether the device has successfully retrieved policy server information. - Cisco documentation describes device inventory resynchronisation, which refreshes a controller's record of a device's configuration and operational state.
- The CCIE Enterprise Infrastructure v1.1 unified exam topics include assurance and automation within the software-defined infrastructure domain.