


On a Juniper SRX chassis cluster, the primary command you need is:
text
show chassis cluster status
This single command reveals, for each redundancy group (RG), which node is primary (active) and which is secondary (standby).
Beyond that, you can monitor the cluster in real time with:
text
monitor chassis cluster status
…and drill into session‐sync health with:
text
show chassis cluster information
These commands together give you a clear, at‐a‐glance view of failover status, session synchronization, and any sticky-hold timers in effect.
Table of Contents
1. Why Checking Failover Matters
High availability is non-negotiable for security gateways. A failover event must be:
- Predictable: You know exactly which node will take over.
- Seamless: Only minimal packet loss (<1%) under normal failover scenarios.
- Observable: You can verify from the CLI (or GUI) that all functions—sessions, policies, routes—have synchronized to the standby node.
Regularly checking failover status ensures that your backup node is truly ready to serve, and that no silent misconfigurations or hardware anomalies will bite you under load.
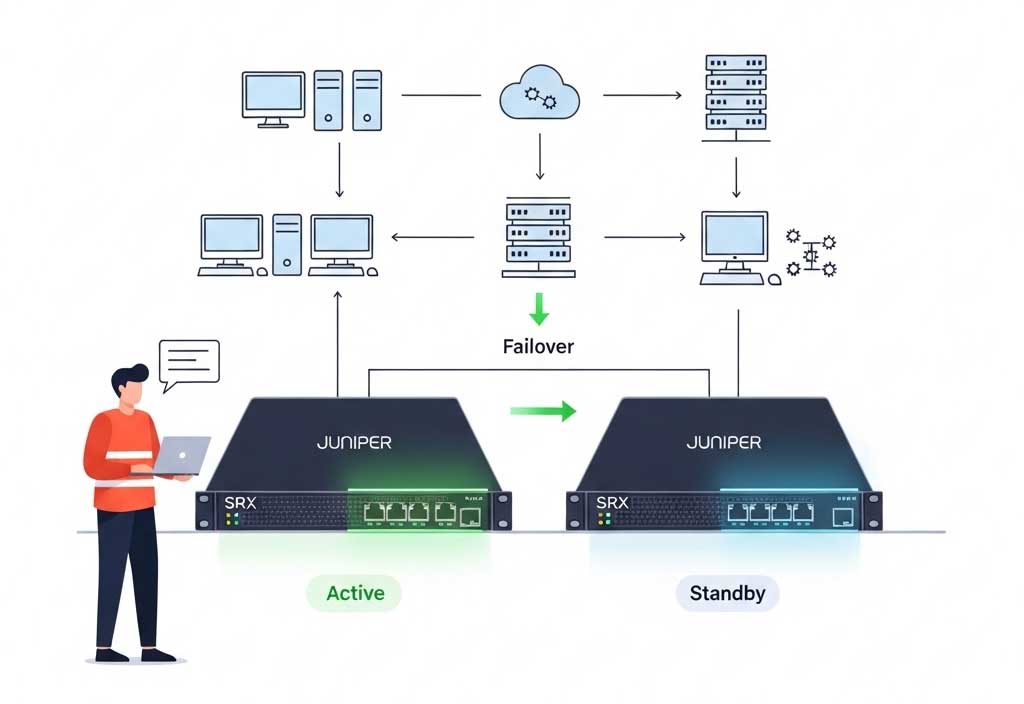
2. Anatomy of SRX Chassis Cluster & Redundancy Groups
A Juniper SRX chassis cluster is composed of two appliances running in an active/standby pair. Junos OS uses redundancy groups (RGs) to bundle interfaces and services:
- RG0 (“control plane”)
Manages which node’s Routing Engine (RE) is active. A manual RG0 failover kills/restarts all control-plane processes on the peer—so use sparingly. - RG1–RG127 (“data plane”)
Each RG can encapsulate one or more reth interfaces, firewall filters, routing instances, or other objects. Failover occurs per-RG independently, so you can load-share traffic across nodes by distributing reth interfaces into separate RGs.
Each RG has three key knobs:
- Priority
Higher-priority node becomes primary. - Preempt (enable/disable)
When enabled, the higher-priority node will automatically reclaim primacy once it recovers. - Interface-Monitor Weights & Thresholds
Assign weights to critical interfaces; if cumulative weight falls to 0, the RG fails over automatically (a “hard” failover).
3. Core Commands to Check Failover
Below is a curated list of the most essential CLI commands. Run these from any node over SSH, console, or Junos Space CLI:
| Command | What It Shows |
|---|---|
show chassis cluster status | Summary of each RG’s primary/secondary status, priorities, preempt/manual-failover settings. |
monitor chassis cluster status | Live updates of any RG state changes—ideal during tests. |
show chassis cluster information | Session sync counters: number of sessions mirrored between nodes. |
show security flow session | Verify which node is processing flows to ensure traffic is on the expected RG. |
show chassis cluster interfaces | RG-to-interface assignments and link statuses. |
show log chassisd / show log messages | Check for any system or failover events logged by the cluster daemon. |
Tip: If you see any RG in a
secondary‐holdstate, it means the standby node has a hold-down timer (default 300 s) before it can be promoted back to primary.
4. Hands-On Failover Testing
Testing failover in a controlled environment lets you quantify exactly how your network behaves under switchover. Two common methods:
4.1 Manual Failover
- Pre-check Ensure Node0 = primary for RG0 & RG1.
text
show chassis cluster status - Execute manual RG1 failover The target node’s RG1 priority jumps to 255, forcing it to become primary immediately.
text
request chassis cluster failover redundancy-group 1 node 1 - Observe traffic
Run rolling pings or BGP neighbors across zones; expect sub-5 ms jitter and zero to few-packet drops. - Reset manual failover If preempt is enabled, the original node reclaims primacy once healthy.
text
request chassis cluster failover reset redundancy-group 1
4.2 Interface-Monitor (Hard) Failover
- Configure interface monitoring
text
set chassis cluster redundancy-group 1 interface-monitor ge-0/0/1 weight 255
set chassis cluster redundancy-group 1 interface-monitor ge-0/0/2 weight 100
- Bring link down
text
deactivate interfaces ge-0/0/1- Watch RG1 flip
The cumulative weight on Node0 drops below its threshold → RG1 fails over automatically to Node1.
5. Interpreting Key Outputs
show chassis cluster status (Excerpt)
text
Cluster ID: 1
Redundancy group: 0  Failover count: 12
    node0   100  primary          no    no
    node1   1    secondary        no    no

Redundancy group: 1  Failover count: 54
    node0   100  primary          yes   no
node1 1 secondary yes no- primary/secondary: Which node is active for that RG.
- Preempt: “yes” means original node will auto-reclaim.
- Manual failover: “yes” indicates a manual bump in priority is still in effect.
show chassis cluster information
text
Cluster ID: 1
Built-in: node0 = master (self), node1 = backup

Session sync: 4321 sessions mirrored
Queue size: 0 / 8192 (current / max)- Session sync: Ensures in-flight sessions survive failover.
Comments